Overview
This documents the process by which we created zoning data files according to the Open Zoning Feed Specification (OZFS) format using already-recorded National Zoning Atlas (NZA) data. The main steps are summarized in the sections that follow.
Data Preparation
Gather Needed Data
Change NZA Column Names
Clean Up Data
Add Columns to NZA
Run R Script
Inputs
Outputs
Manual Adjustments
Data Preparation
Gather Needed Data
The NZA often has two files for each city: a tabular file storing all the zoning regulations, and a geojson file storing the zoning district geometries. To convert to OZFS, these two files were required for each city. The table below gives more details on the files used in the R script. Because the geometry file stored an abbreviated district name attached to its geometry, we didn’t need to change anything in that file, but there were some changes needed to prepare the tabular data.
Change NZA Column Names
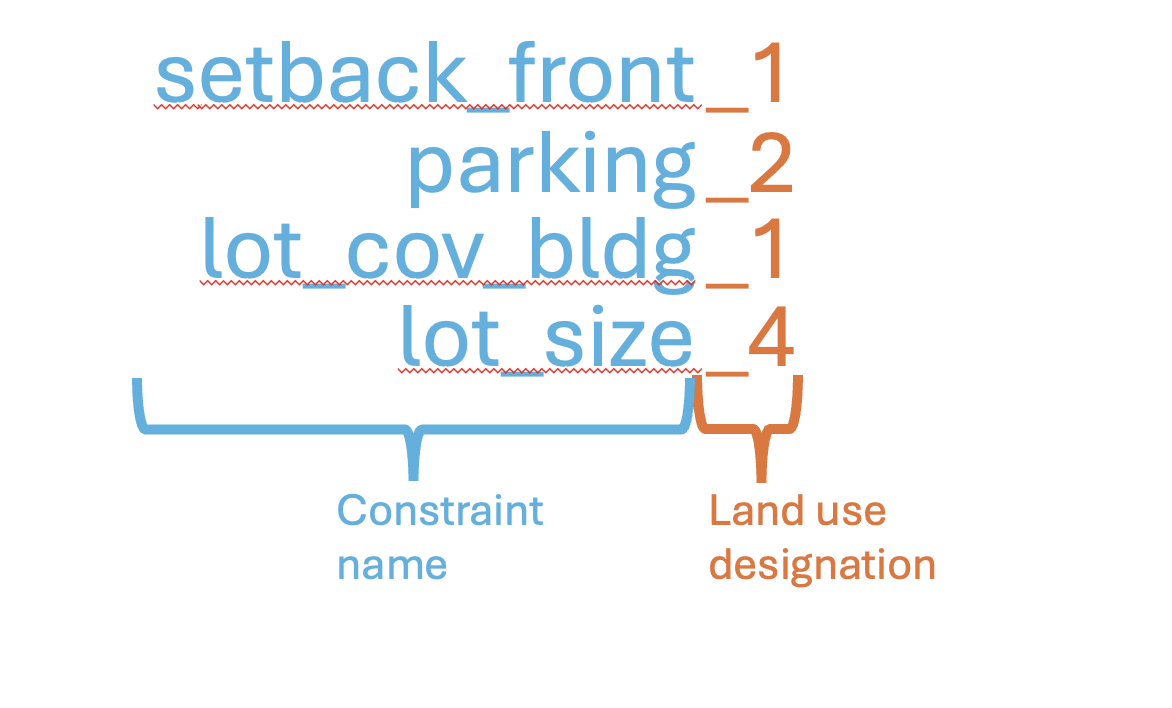
With the tabular data as an Excel(.xlsx) file, we changed the names of each column for easier reading and manipulation in R. There will hopefully be an R script that can automatically change the column names, but that doesn’t exist yet, so we manually changed them. As shown in the figure below, the new column name is generally created by the constraint name, as it appears in the OZFS, followed by a representation of the land use. The string “_1” for 1-family treatments, “_2” for 2-family treatments, “_3”, for 3-family treatments, and “_4” for 4+family treatments. A table comparing the old and the new file names can be found [here].
Clean Up Data
Newer versions of the NZA may not have this, but the data we had was often stored inconsistently. For example, some parking requirements would be listed simply as “2” while others would be listed as “2/DU” indicating 2 spaces per dwelling unit. For the code to read the data properly, we needed to go through each cell and make sure it was either a single value or an equation readable by the R code.
An equation was created when the NZA data indicated some dependent value. For example, when the front setback is equal to half of the lot’s width, an equation is needed instead of a single value. Equations were stored as strings. To work with the R script, they could only contain variables acceptable by OZFS, and they needed to follow Python syntax as required by OZFS.
Add Columns to NZA
Columns not recorded in NZA
As part of the data clean-up, there were some columns that needed to be added. A few additions were columns for constraints not recorded in the NZA format but needed for the OZFS format: setback_side_ext, parking_enclosed, parking_uncovered, parking_covered.
While some cities have different setbacks for corner lots with an exterior side and a front side, NZA only has one place to store the side setback value. We used the notes of the excel file to add a value for the exterior side setback.
The parking columns needed to be updated in a similar way. For all but 1-family treatments, the NZA format has two fields for parking requirements: Parking Per Studio/1BR, and Parking Per 2+ BR. To convert to OZFS format, we needed to combine these into one. This was usually assigned to the parking_uncovered column, but parking_covered and parking_enclosed columns could be added if the excel notes specified.
Columns to represent conditional constraints
Perhaps the most difficult manual adjustment to the tabular data was adding columns to represent conditional constraints or criteria-based requirements. With these types of constraints, the NZA format often recorded one value and then left a special note about the condition or criteria, but the OZFS has a way to store some of these conditional and criteria-based requirements. The pattern we used for naming these additional columns was based on the OZFS format, which can contain multiple lists of rules describing how a constraint is calculated. The possible fields in each list of rules are described as follows:
expression: Every rule list will have an expression, or list of expressions, used to get a constraint value.
condition: This field will be present if the constraint value is conditional to another value; like building height, lot width, etc. The condition must be written using Python syntax. (ex. “height >= 10 and lot_width < 60”)
criterion: This field is included when there is a “min” or “max” criterion that determines the constraint value from a list of multiple expressions. If there are conditions that can’t be expressed by OZFS standards, then multiple expressions can be given with the criterion “dependent”.
more_restrictive: If there is a “dependent” criterion, this field will explain the case that merits the more restrictive constraint value listed.
When the constraint in the NZA data was recorded as a single value or expression, it was left in the original cell. If there were constraints requiring a conditional rule or a criterion, then new columns were added to the excel file. The names of the new columns followed a specific pattern that stated the rule number and the rule item that was being recorded. This rule number and rule item were placed in between the constraint name and land use designation as shown in the figure below.
To illustrate this, text from an example city’s zoning code is given:
For single family homes less than or equal to 36 feet in height, the minimum front setback is equal to the height of the building but need not exceed 30 feet. For single family homes greater than 36 feet in height, the minimum front setback is 40 feet.
Unlike the NZA, the OZFS standard has a specific way to represent this unique constraint, and the figure below shows how it would be structured. The table shows how this information was added to the NZA excel sheet using the column naming pattern. Note that the original column indicating the name and land use was kept and left blank. This original column left blank was need for the code to work properly.
Run R Script
After cleaning and preparing the data, we created an R script to convert it into the OZFS format. See the raw R script here. The following sections briefly describe the inputs, outputs, and final adjustments made.
Inputs
The R script has three inputs: The path to a folder of tabular data files, the path to a folder of district geometry files, and the path to a folder where the newly created .zoning files will be stored. It is important to note that the order of each file in the folders mattered. For the R script to work, the geometry folder needed to have one file per city in the exact same order that the tabular data folder listed its cities’ files. We did this by naming each file by the city it represented.
Outputs
The R script creates the OZFS .zoning file for each city and puts them in the specified folder. After running the R script, we needed to make a few manual updates that we haven’t put in the R code yet.
Manual Adjustments
The only manual adjustments we made were to the height definitions that appear at top level of the .zoning file. The R script only added generic height definitions, so we needed to go into each .zoning file and make any adjustments to the height definitions to match what is recorded in each individual zoning code.